
Description
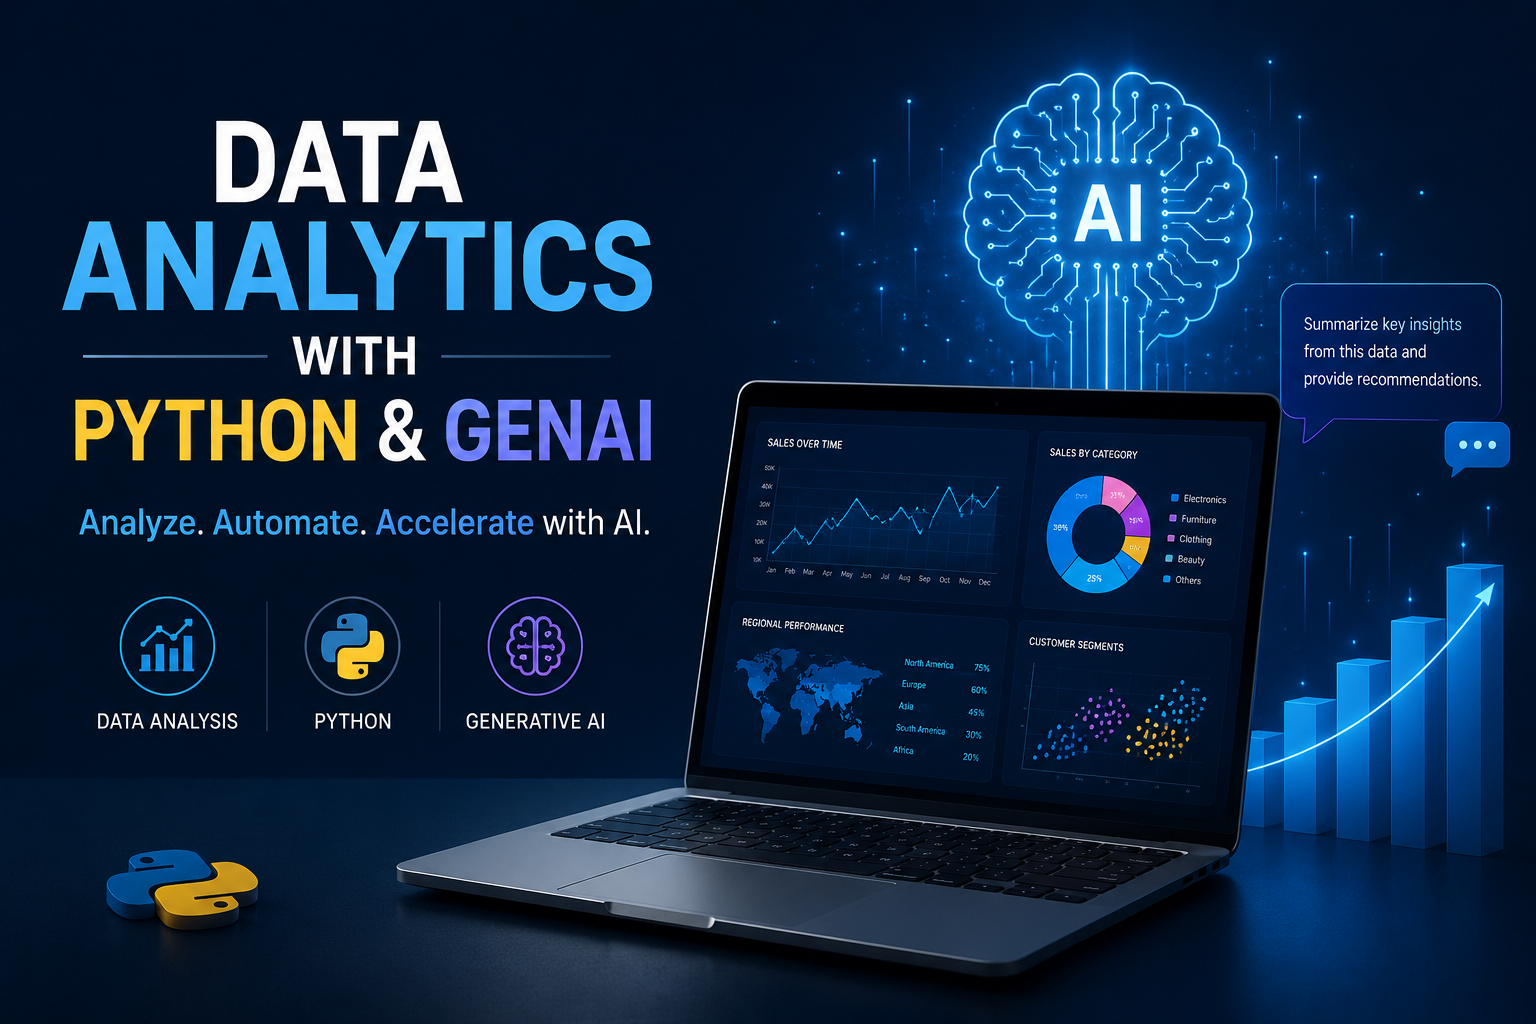
Overview: Combining Python and Generative AI (GenAI) fundamentally changes how we clean, analyze, and visualize data by acting as an intelligent co-pilot that automates repetitive coding workflows and uncovers non-obvious business insights. Instead of writing manual code for every statistical test, analysts now use large language models (LLMs) to generate python structures, debug complex queries, and converse with datasets using natural language.
Platform: Anaconda Distribution (Jupyter Notebooks & JupyterLab)
Audience Level: Complete Beginner (No prior coding experience required)
____________________________________________________________________________________________________________________________________________________________________________________________________
DAY 1: ANACONDA BASICS & TALKING TO YOUR DATA
🌅 MORNING SESSION (09:00 – 12:30)
Module 1: The Anaconda Ecosystem & AI Setup (09:00 – 10:30)
- Anaconda Navigator: Launching your development space visually without typing terminal commands.
- Jupyter Notebooks: Mastering the interface, managing code cells, and writing formatted text notes.
- AI Persona Setup: Configuring your generative AI tool (ChatGPT/Claude) to act as a patient python tutor.
- The Golden Prompt: Learning the exact prompt template to force AI to output beginner-friendly code.
☕ Morning Break (10:30 – 10:45)
Module 2: Loading Data into Python (10:45 – 12:30)
- The Pandas Library: Introducing “DataFrames” (the data analyst’s version of an Excel spreadsheet).
- File Ingestion: Writing your first lines of code to import standard CSV and Excel sheets into your notebook.
- Data Inspections: Using simple commands like .head() and .info() to view your spreadsheet structure.
🍱 Lunch Break (12:30 – 13:30)
🌇 AFTERNOON SESSION (13:30 – 17:00)
Module 3: Cleaning Messy Data Without Stress (13:30 – 15:00)
- Error Detection: Asking AI to scan your data frame layout to flag missing values, blanks, and duplicate rows.
- Data Correction: Generating Python code to automatically drop empty rows or fill missing cells with averages.
- Format Alignment: Fixing broken dates and misaligned text fields using automated AI-assisted scripting.
☕ Afternoon Break (15:00 – 15:15)
Module 4: Conversational Analysis & Lab 1 (15:15 – 17:00)
- Natural Language Queries: Setting up PandasAI to chat directly with your datasets.
- No-Code Aggregations: Typing plain questions like “What were the total sales per region?” to get immediate answers.
- Hands-on Lab 1: Loading a messy operational dataset, executing a diagnostic scan, and producing a pristine data table.
📅 DAY 2: MAKING CHARTS & UNLOCKING INSIGHTS
🌅 MORNING SESSION (09:00 – 12:30)
Module 5: Visualizing Data with AI Templates (09:00 – 10:30)
- Visualization Engines: Meet Matplotlib and Seaborn, Python’s primary charting packages.
- No-Syntax Charting: Describing your ideal chart to your AI assistant to generate flawless visualization code.
- Chart Customization: Adding clear titles, readable axis labels, and brand-appropriate colors to your graphics.
☕ Morning Break (10:30 – 10:45)
Module 6: Basic Math & Data Filtering (10:45 – 12:30)
- Data Segmentation: Slicing through data using date ranges, geographical regions, or product categories.
- Descriptive Math: Understanding how Python calculates core metrics like averages and distributions:
\(\text{Group\ Average}=\frac{\text{Sum\ of\ Values}}{\text{Total\ Count}}\) - Trend Identification: Spotting high-performing clusters and operational anomalies using targeted data groupings.
🍱 Lunch Break (12:30 – 13:30)
🌇 AFTERNOON SESSION (13:30 – 17:00)
Module 7: AI Executive Reporting & Data Privacy (13:30 – 15:00)
- Automated Summaries: Passing your raw Python calculations to an LLM to generate professional bullet-point updates.
- Contextualizing Insights: Translating dry numbers into actionable, human-readable business narratives.
- The Privacy Shield: Learning how to anonymize and mask data columns before sharing schemas with public AI tools.
☕ Afternoon Break (15:00 – 15:15)
Module 8: Grand Finale Capstone Lab (15:15 – 17:00)
- End-to-End Pipeline: Applying everything you learned to a brand-new, unpolished sample dataset.
- Execution Milestones: Independently cleaning the source file, building two charts, and writing an executive summary slide deck.
- Wrap-up: Troubleshooting remaining syntax questions, resource distribution, and next steps for your career journey.
💻 SOFTWARE INSTALLATION CHECKLIST
Please execute these two actions on your laptop prior to Day 1:
- Download Anaconda: Visit the Anaconda Distribution Download Page and install the free Python 3.x version matching your operating system (Windows or Mac).
- Verify Setup: Open Anaconda Navigator from your applications folder and confirm that you can successfully click “Launch” under the Jupyter Notebook tile.


Reviews
There are no reviews yet.