

Overview : The course is structured to maximize code output per prompt. It uses universally available public datasets (like supermarket sales, website traffic, and global city metrics) that are built into Python or easily downloadable.
📌Local Setup, AI Prompting & Static Charts
Focus: Mastering Anaconda, talking to AI, and building corporate-ready static charts
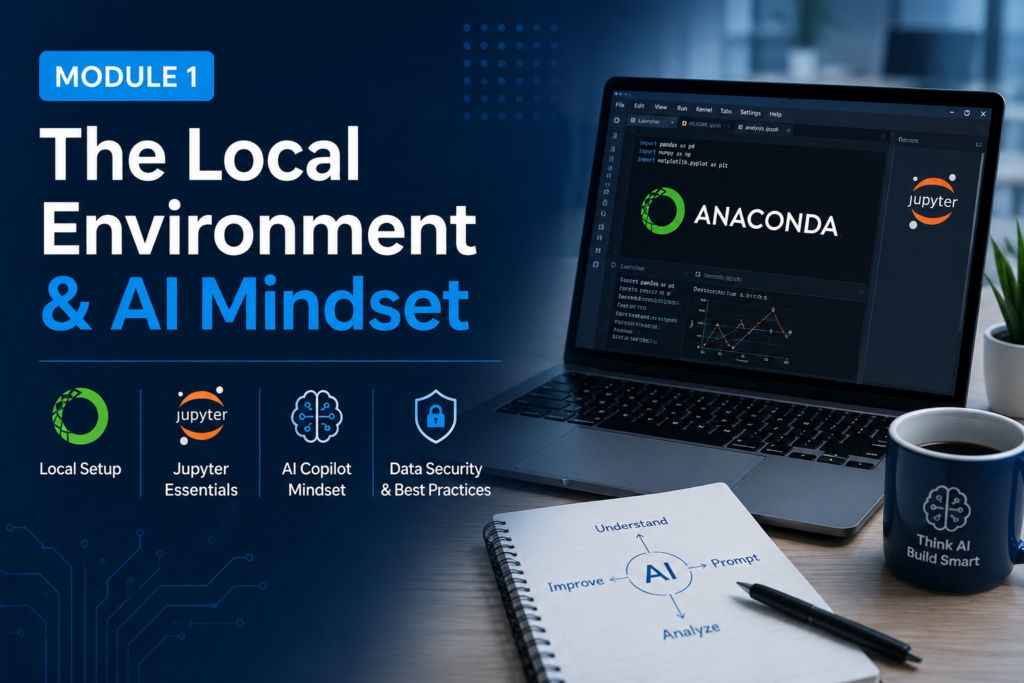
- Local Setup: Launching Anaconda Navigator, opening Jupyter Notebooks, and managing the folder directory.
- Jupyter Essentials: Running cells, writing notes in Markdown, and identifying when code is executing
- The AI Copilot Mindset: Understanding how LLMs write code, why they hallucinate, and why they excel at syntax.
- Data Security on Free AI Tiers: Strict rules for using public AI safely without leaking private company data.
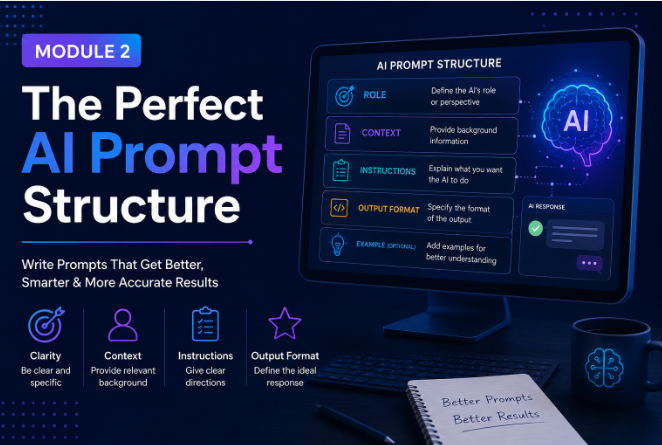
- The Role-Task-Context Framework: Writing prompts that tell the AI it is a senior Python developer working in Jupyter.
- Describing Data to AI: How to copy-paste dataset structures (column names and types) into the AI interface.
- First Code Gen: Prompting AI to write a script that loads a local CSV file into Python using the pandas library.
- Exercise: Participants prompt the AI to load a practice dataset and display the first five rows.
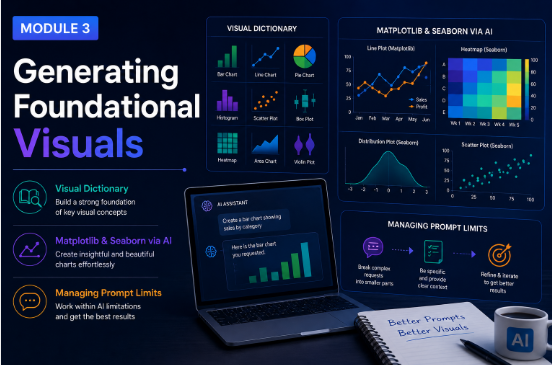
- The Visual Dictionary: Asking AI to recommend chart types based on data patterns (e.g., lines for time, bars for categories).
- Matplotlib & Seaborn via AI: Generating code for standard bar charts, line graphs, and scatter plots.
- Managing Prompt Limits: Strategies for writing concise prompts to conserve the free AI tier’s hourly message allowances.
- Exercise: Instructing the AI to generate a clean, labeled bar chart showing sales performance.
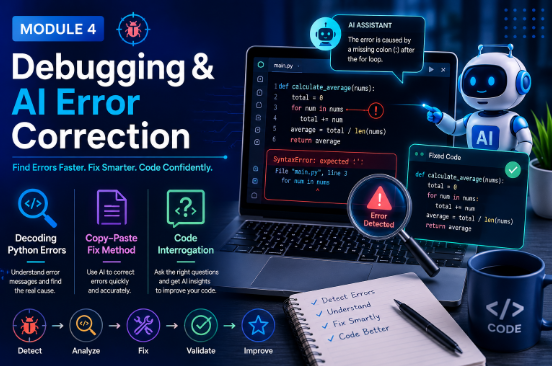
- Decoding Python Errors: Recognizing common beginner mistakes like syntax slips and missing libraries.
- The Copy-Paste Fix Method: Copying raw error messages from Jupyter directly into the AI to get immediate, working fixes.
- Code Interrogation: Asking the AI to explain what its generated code actually does line-by-line.
- Exercise: Intentionally breaking code, feeding the error to the AI, and implementing its fix.
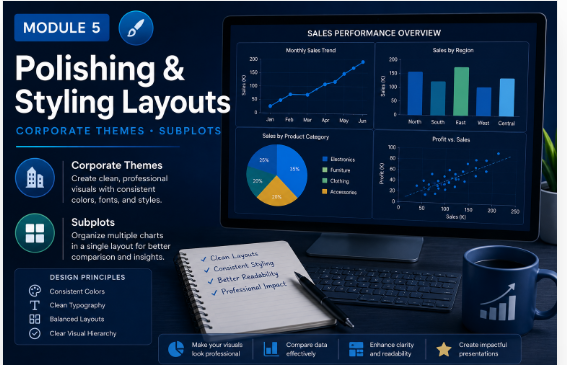
- Corporate Themes: Asking AI to remove distracting gridlines, adjust font sizes, and add professional color palettes.
- Subplots: Requesting the AI to combine multiple small charts side-by-side into a single dashboard image.
- Exercise: Transforming a basic, ugly chart into a polished graphic ready for an executive presentation slide.
📌Advanced Cleaning, Interactive Plots & Automation
Focus: Fixing broken files, creating interactive charts, and building automated data stories.
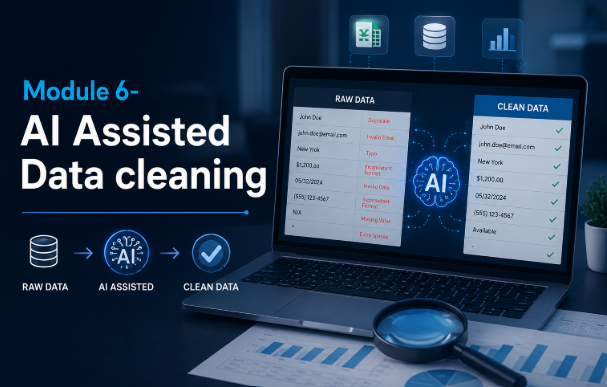
- The Messy Spreadsheet Problem: Identifying missing values, duplicate entries, and incorrect dates.
- Prompting for Cleanup: Instructing the AI to write robust Python scripts that scrub and standardize data automatically.
- Feature Engineering: Asking the AI to create new calculated columns (e.g., pulling “Month Name” out of a raw date column).
- Exercise: Cleaning a dirty marketing dataset entirely through AI-generated script blocks.
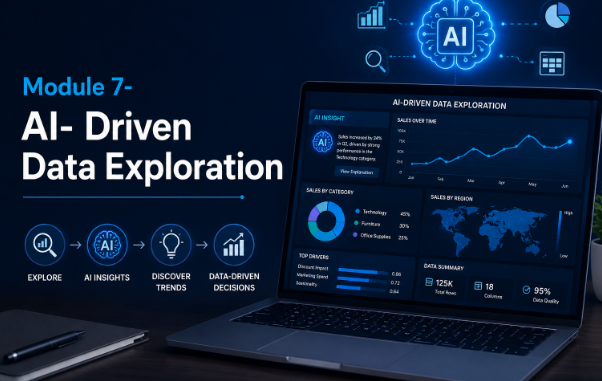
- Blind Exploration: Copying your dataset’s columns into the AI and asking: “What are the three most interesting stories in this data?”
- Statistical Visuals: Prompting AI to generate histograms and box plots to uncover hidden data trends and anomalies.
- Exercise: Running an AI-guided exploration on a retail dataset to discover hidden product purchase behaviors.
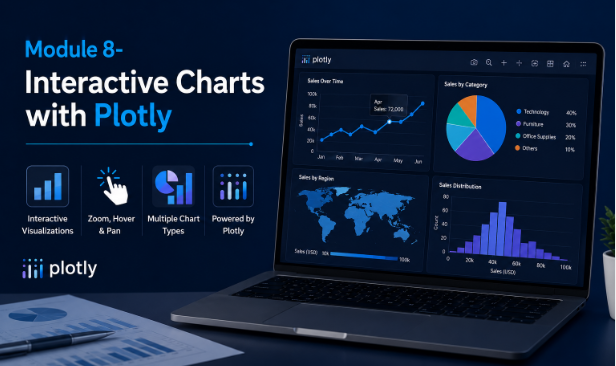
- Static vs. Interactive: Introduction to Plotly charts that allow hovering, zooming, and panning inside Jupyter.
- Dynamic Geoplots: Prompting AI to generate interactive map charts using country or city name data.
- Dependency Resolution: Asking AI how to safely run conda install or pip install when a library is missing.
- Exercise: Generating a fully interactive, zooming scatter plot of global metrics using AI.
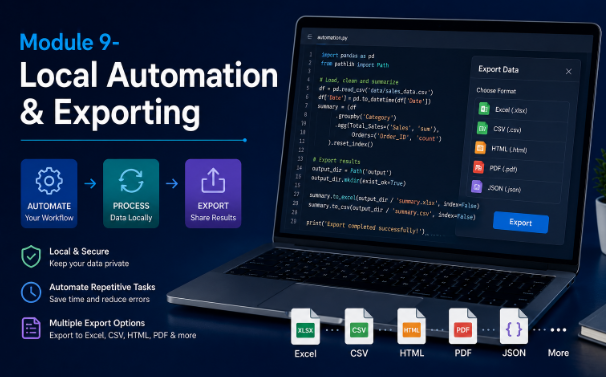
- Batch Exporting: Telling AI to write a loop that automatically saves twenty individual charts as high-res PNGs in a local folder.
- Interactive HTML Reports: Code generation to export interactive Plotly charts as portable HTML files that open in any web browser.
- Automated Narratives: Asking the AI to write bulleted, analytical commentary based on the chart trends it produced.
- Exercise: Writing a script that processes a dataset, generates three charts, writes a text summary, and saves it locally.
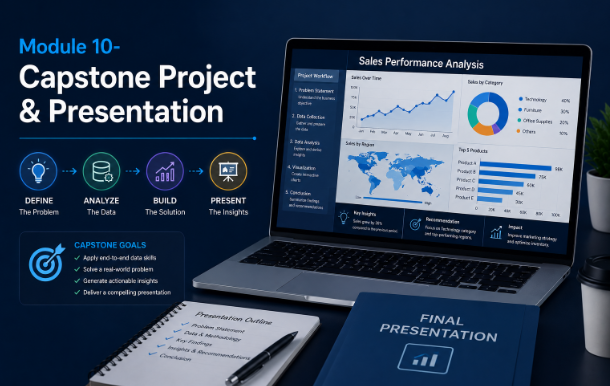
- The Independent Challenge: Participants receive a completely fresh, uncleaned public dataset.
- Execution: Using exclusively AI prompts, students clean the data, discover trends, generate an interactive visual dashboard, and export it.
- Review: Showcase individual dashboards and discuss how to apply these workflows to real-world corporate tasks.